
Europe’s Race to Rearm Opens Global Opportunities
Europe’s urgent push to rearm has shone a light on the continent’s defense companies and their shares.
In reality, though, Europe’s rebound in defense spending is likely to affect contractors around the globe.
After languishing at low levels since the end of the Cold War and collapse of the Soviet Union in 1991, Europe’s defense spending is recovering as the Ukraine war grinds into its third year. The Pax Americana period of US dominance that kept relative peace is waning and European governments have little choice but to rearm.
But Europe is buying a significant amount of arms abroad. European arms imports increased by 155% between 2015-2019 and 2020-20241, according to the Stockholm International Peace Research Institute (SIPRI). Unsurprisingly, Ukraine was among the top 10 importers of US arms in the latter period, but so too were the United Kingdom, the Netherlands and Norway.
While Europe’s defense industry is now gearing up and its anticipated growth has yet to show up in backward-looking data, the continent’s governments are directing significant spending to the big US contractors that currently have the manufacturing capacity and technology they need. That’s despite the European Union’s stated preference for buying arms within the bloc2. It is worth noting that for investors in defense stocks, the concentration in defense equities can amplify losses during policy shifts or peace negotiations, and government export bans or sanctions may restrict company revenues.
Europe’s surging defense spending
In May, the EU’s announcement of a €150 billion loan-for-arms fund, known as Security Action for Europe (SAFE), showed its seriousness about a five-year rearmament plan. At the same time, countries are increasing spending from national budgets to meet and exceed the NATO ( (North Atlantic Treaty Organisation) military alliance’s commitment of spending 2% of gross domestic product on defense – a level that’s expected to rise shortly.
SAFE’s emphasis on European production largely explains why European defense contractors’ shares have risen so far. It allows EU countries to borrow from Brussels and spend on weapons systems and platforms through joint procurement, providing at least 65% of the value of the components are from arms companies in the EU and specific neighboring countries. Similarly, the European Defense Industrial Strategy3, published in March 2024, proposes EU countries should buy at least 50% of their defense needs from EU contractors by 2030, rising to 60% by 2035.
But that still leaves a lot to be purchased elsewhere, especially as many European countries already mainly buy domestically, according to analysis from economic thinktank Bruegel4 that differs from the EU’s own numbers. For instance, imports made up less than 2% of France’s defense equipment expenditure in 2023 and less than 4% of Germany’s, although Poland’s imports accounted for almost 18% (see chart).
Imports as share of defense procurement in selected European countries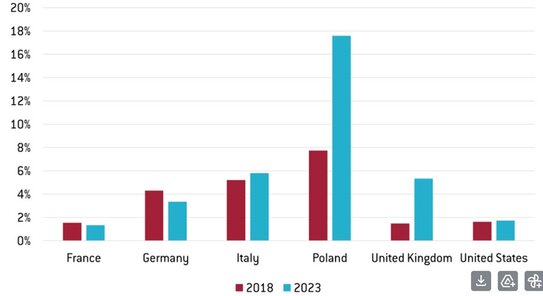
Source: Bruegel calculations, as of 4 July 2024.
US manufacturers are growing fastest
Whether due to US military needs or imports from Europe and elsewhere, US defense manufacturers are currently growing fastest. In 2023, the 41 US companies among the top 100 arms producers grew their revenues by 2.5%, according to SIPRI5. Yet the 21 European companies in the top 100 increased revenues by just 0.2%6, the smallest increase in any world region. On the investor side, this all made defense companies more liquid than they used to be, even though some companies are still quite illiquid and heavily volatile7.
European armed forces may have little choice but to buy US arms if they want the most up-to-date and capable military equipment. That’s because the US has maintained investment in research and development over recent decades while it has dwindled in Europe.
In support of its defense technology, the US budget for so-called research, development, test and evaluation totaled $118.7 billion in 2022.8 By contrast, European spending on research and technology fell by €200 million in 2023, according to European Defense Agency data.
The case for diversification
Even so, European defense stock prices have surged in anticipation of a once-in-a-generation expansion in the continent’s military. Shares in some European arms manufacturers tripled in the five months of 2025 to the end of May9 and are trading on a price/earnings (P/E) ratio valuation of more than 100. This rapid development also increases volatility and the potential for rapid losses. By contrast, the VanEck Defense UCITS ETF, which holds 28 stocks10 from eight countries, saw its price rise by under half in the five months11 to the end of May 2025 (and more than 70% in the last 12 months) – still a significant rally but far short of some of the European defense stocks (albeit at a fraction of their volatility)12. The ETF has an average P/E ratio of 3013.
Performance Comparison14
1 Month | 3 Months | YTD | 1 Year | 2 Years | Since Fund Inception | |
MarketVector™ Global Defense Industry Index | 7.71 | 35.87 | 48.87 | 71.11 | 60.93 | 58.12 |
MSCI World Index | 5.92 | 2.10 | 4.95 | 13.72 | 19.17 | 17.97 |
Source: Morningstar, as of 31 May 2025. Past performance does not predict future returns. The ETF was launched on 31 March 2023.
*Periods shorter than one year represent cumulative performance.
**Periods greater than one year are annualised.
While an arms race is underway in Europe and elsewhere, investing bears some political risk in addition to the industry’s specific inherent financial and operational uncertainties. Were the Ukraine war to end this year, as unlikely as that seems, EU countries could curb their military ambitions, leading to falls in the shares of Europe’s defense companies. It might be prudent, therefore, to diversify holdings internationally, rather than simply buying European stocks.
Martijn Rozemuller, Chief Executive Officer Europe, VanEck
1SIPRI TRENDS IN INTERNATIONAL ARMS TRANSFERS, 2024, published in March 2025
2Security Action for Europe (SAFE) instrument, published in May 2025 https://www.consilium.europa.eu/en/press/press-releases/2025/05/27/safe-council-adopts-150-billion-boost-for-joint-procurement-on-european-security-and-defence/
3European Defense Industrial Strategy, March 2025 https://www.europarl.europa.eu/RegData/etudes/BRIE/2024/762402/EPRS_BRI(2024)762402_EN.pdf
4What role do imports play in European defence? Bruegel, as of 4 July 2024.
5THE SIPRI TOP 100 ARMSPRODUCING AND MILITARY SERVICES COMPANIES, 2023, published in December 2024
6THE SIPRI TOP 100 ARMSPRODUCING AND MILITARY SERVICES COMPANIES, 2023, published in December 2024
7VanEck analysis, Bloomberg data 1995 – 2025.
8Analysis of Department of Defense Funding for R&D and RDT&E in FY 2022. Published October 2024.
9Bloomberg, close of 30 May 2025
10VanEck website, portfolio composition as of 30 May 2025
11For more information, please visit vaneck.com/ucits/dfns/
12VanEck, close of 30 May 2025
13VanEck, close of 30 May 2025
14MarketVector Index tracks the overall performance of companies serving national defense industries. MSCI World is a broad benchmark tracking the performance of companies in developed markets.

Le décret modernisant les modalités de communications des sociétés commerciales avec leurs actionnaires a été publié au...

La Commission européenne a publié le 20 novembre 2025 sa proposition finale législative très attendue visant une refonte...

La 6e édition du European Investor Summit de SGSS s'est déroulée le 7 octobre 2025 aux Tours Société Générale à La...

Le processus de transposition de la Directive sur les gestionnaires de fonds d’investissement alternatifs EU 2024/927...

Jusqu’à présent la mise en œuvre du cycle de règlement / livraison (R/L) à un jour en Europe après la date d’exécution...